We’re advancing backward in a forceful way.
Most of you probably don’t pay a whole lot of attention to Farm Bureau communications, but I do, so you don’t have to.
A week ago (11/24/25) the Pillar of Truth and Integrity on University Avenue in West Des Moines published a piece on their website titled “Data shows Iowa water quality improving.”
Water quality is not one thing, and making statements on trends about even one component, let alone the overall condition, is the trickiest of tricks when it comes to researching these things. Different people can come to different conclusions and they can all be correct depending on their methods and especially the time period examined. Any statement on trends needs to be carefully examined for:
-
The beginning and end years. Study periods beginning or ending (or both) in years of climate extremes tend to produce conclusions that are less robust than research conducted otherwise. This is not to say the former doesn’t have merit. Sometimes you just gotta write a paper because your graduate student wants to graduate and with the weather being what it is, you may have no choice if you want the research to be most timely. But let’s just say cherry picking your study period to reach a pre-ordained conclusion isn’t exactly unheard of in this business. Conclusions based on many years of data are usually much more robust than those reached from only a few years’ data.
-
Whether or not the conclusions are based on actual water quality data. That is the gold standard, but most people in agriculture prefer a tin standard, that being trends modeled around best management practice adoption. The problem with that approach is that the ag production system lacks ‘stationarity’, especially with regard to weather but also the fact that adoption of or retreat to bad practices can dwarf improvements generated by newly adopted good practices. Livestock populations and acres cropped to one thing or another are also variable, and these can both bolster and cast doubt upon conclusions. A whole lot of computational and statistical modeling is done for one important reason: water quality monitoring extensive enough to reach sweeping conclusions is very expensive. Almost all scientists and engineers studying environmental systems use both computational and statistical modeling at some point, although my experience is that engineers are more fond of modeling than scientists, probably because they think the best way to show off is to flex their math muscles.
The Farm Bureau (FB) piece, which now appears to have been edited since its original posting, claims the Central Iowa Source Water Research Assessment (CISWRA) misrepresents actual water quality and the trends in the Raccoon and Des Moines River watersheds for nitrogen (nitrate-N) and phosphorus (P). These nutrients are the cause of Iowa’s most urgent water quality problems and their unnaturally high levels in lakes and streams are a feature of the corn/soy/CAFO/ethanol production system.
The CISWRA report has remained in the news for some time now and you know the story has traction if FB sees a need to try to discredit it. It’s worth pointing out that the report’s conclusions are not substantially different from those reached by the 2012 Science Assessment for the Iowa Nutrient Reduction Strategy, an endeavor that FB supported and applauded.
The initial FB posting seemed to hang its hat on the scientific concept of ‘flow normalized’ (or adjusted or weighted) levels of N and P used in some U.S. Geological Survey research. This technique attempts to factor out the variations in streamflow associated with nutrient pollution. Flow-normalized pollution levels are not approximations of what has occurred, but rather what might have occurred if there was ‘stationarity’ in stream flows. FB and other Aggies like this concept because it gives them a lifeline to blame the pollution on the weather. Interestingly, the Nutrient Reduction Strategy goals are not based on these metrics, but on the load, i.e. the mass of the pollutant transported by Iowa streams. But progress toward load goals (45% reduction) has been so hard to come by that the Aggies are grasping for other metrics that might tell a different story. Finally, the period of study of the USGS work ended in 2023, a dry year and one of low nutrient pollution statewide.
The most current version of the FB article avoids mentioning ‘flow normalized’ (or adjusted) and has unhitched its wagon from claims that USGS research shows declines in nutrient levels. The current version still, however, disputes the CISWRA claim that nutrient pollution has doubled over the past 50 years without providing any evidence or literature citations supporting the FB position. It also features these suppositories that guilt-averse agriculturists can clench their sphincter around:
“For example, in the CISWRA report, Des Moines Water Works reported an average value of nitrate concentrations of 6.0 mg/L in the Des Moines River and 6.5 mg/L in the Raccoon River, both below the EPA’s safe drinking water level of 10 mg/L. First, average concentrations of 6.0 and 6.5 mg/L nitrate are crazy high for streams the size of the Raccoon and Des Moines. These are some of the highest concentrations in North America (if not the world) for average nitrate, again in streams of this size. Second, the average concentration matters not to a water utility using such streams. What matters is the peak concentration and the time the stream spends above the drinking water standard of 10. Peak concentrations can exceed 24 mg/L (Raccoon) and 17 mg/L (Des Moines) and both rivers can remain above 10 for months at a time.
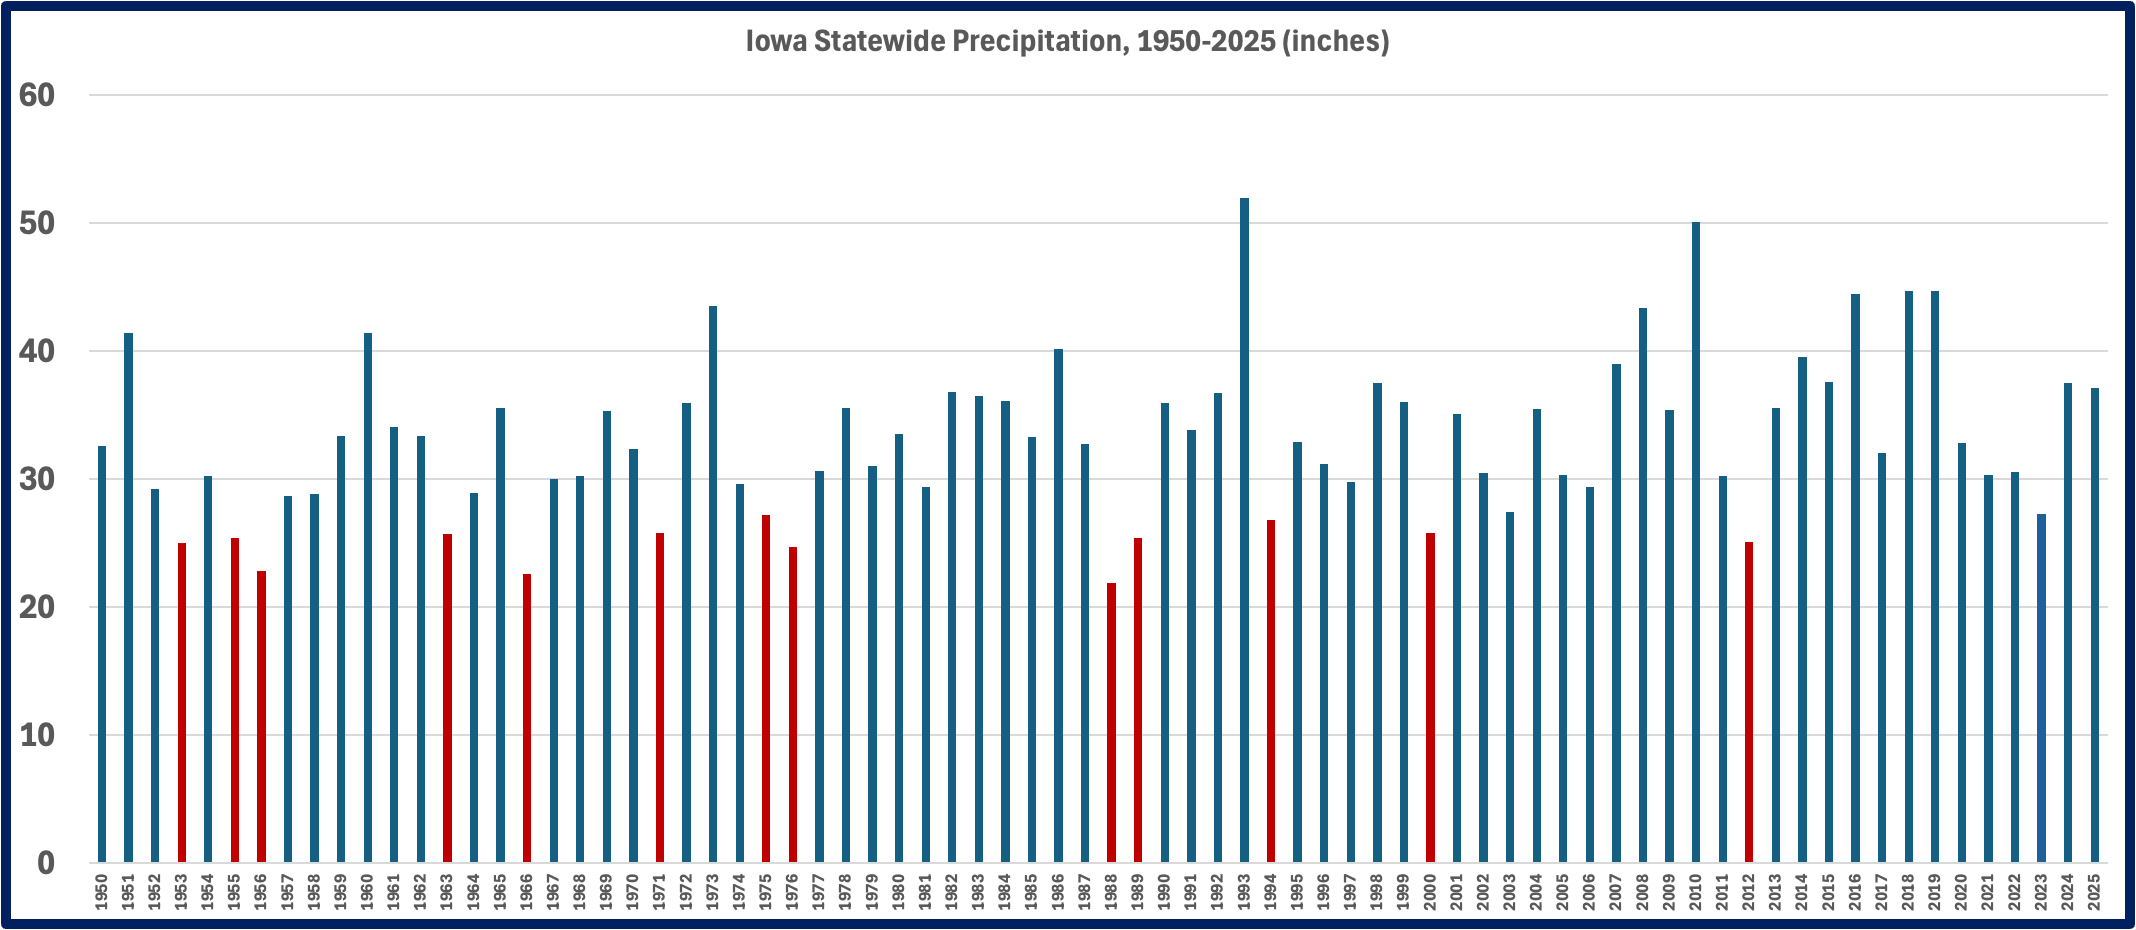
“Iowa has always experienced seasonal spikes and outlier years — such as the floods of 1993 and 2008 and, more recently, the intense spring rains following the state’s worst drought since the 1950s.” The FB writer here is conflating loads (mass of the pollutant transported by the river) and concentration (mass divided by volume). Nitrate concentrations in 1993 and 2008 were actually modest and nitrate removal was not required in Des Moines. Loads were very large because of the deluge conditions. The writer also seems to be implying we’ve just experienced the worst drought since the 1950s. Here is Iowa statewide average rainfall since 1950. You be the judge. The 13 driest years since 1950 are in red.
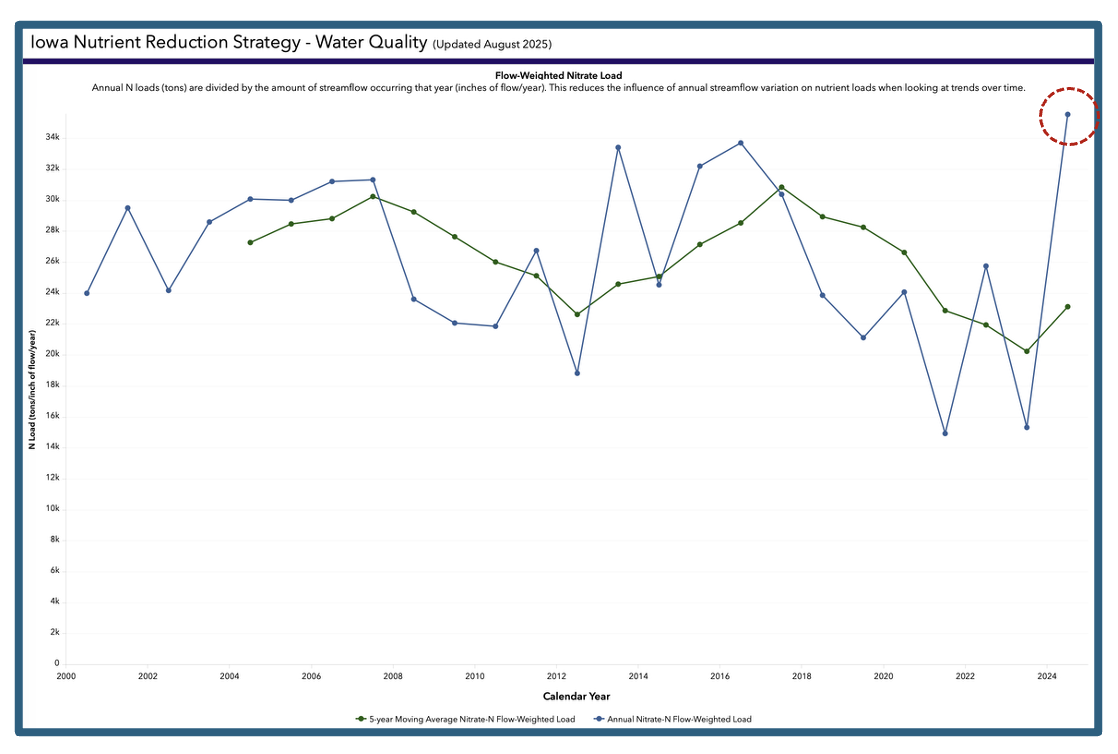
The Farm Bureau article does helpfully guide us to the Iowa Nutrient Research Center’s dashboard, hosted by Iowa State. (Visualize me slow clapping right now.) This ostensibly tracks progress toward the Iowa Nutrient Strategy’s objectives (45% reduction in loads), but one can see that ISU has now also latched onto the ‘flow adjusted’ concept (they’re using the slightly different metric of ‘flow weighted’.) Nonetheless, be still my beating heart! The last year reported (2024) SHOWS THE HIGHEST FLOW WEIGHTED NITRATE LOAD SINCE 2000! Me thinks somebody at ISU read that original FB piece and got on the horn to Evil Empire HQ and said “Whoa Nellie.”
Although not as current, there’s another shiny nugget on the Nutrient Center Dashboard that Farm Bureau staff clearly aren’t up to interpreting (one has to wonder if they check out the links they post in their articles). That’s the Changes in Modeled N Load (2022) for Practices Since the Baseline Period. I’m helpfully showing that for you below.
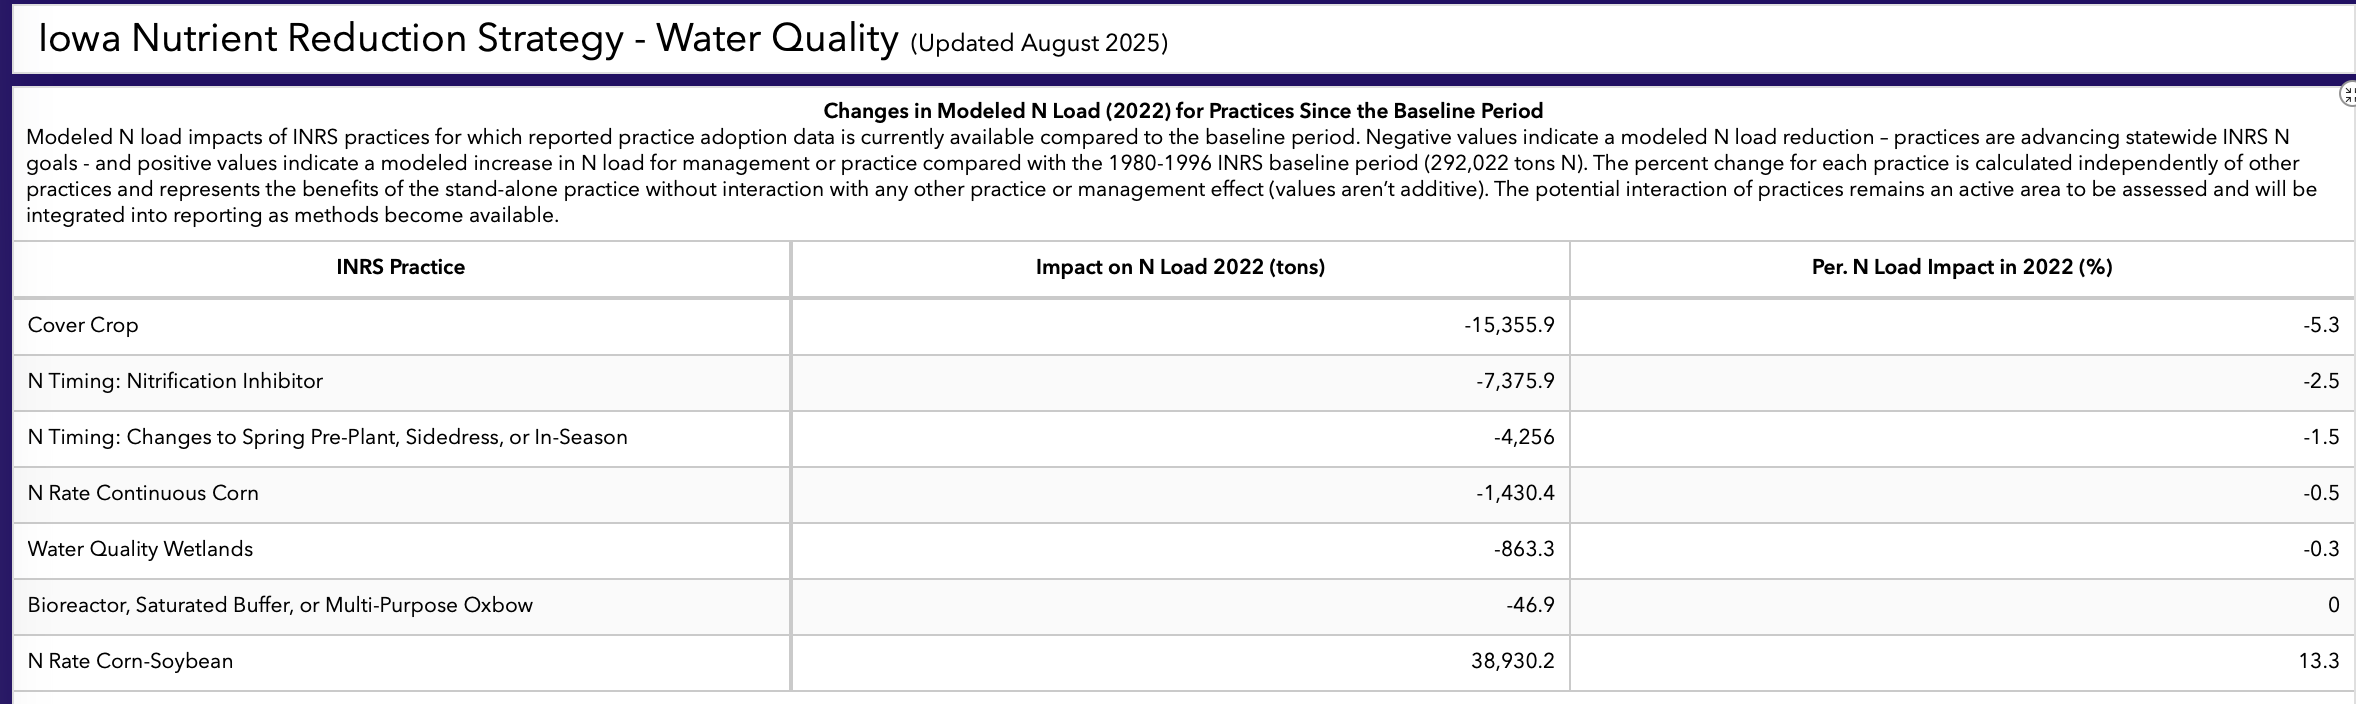
You might recall that everyone in the Big Ag decision chain, from the clerk recording anhydrous ammonia orders at your local Ag retailer, on up to Governor of Iowa Kim Reynolds, says that farmers are not (gasp) over applying nitrogen. Well, well, well. The table shows that the major nitrate-reducing practices have reduced nitrate loads by 29,328 tons per year, while increased nitrogen application rates (compared to the 1981-1996 baseline) have bloated statewide nitrate loading by 38,930 tons per year. So after 12 years, we’re about 10,000 tons per year to the bad on the state’s Nutrient Reduction Strategy. How about a beefy Farm Bureau cheer for the VOLUNTARY ONLY strategy. “Hip, Hip Hooray! Hip, Hip Hooray! Hip, Hip Hooray! Dudes—YOU GOT THIS! (Imagine me doing an air fist bump right now).
Farm Bureau ends the piece by saying “This editorial was also submitted to news outlets in the Quad Cities, Des Moines, Iowa City and Cedar Rapids.” Genius move boys, pure genius. Farm Bureau also tells us the editorial was signed by “Iowa Corn Growers Association (ICGA), Iowa Soybean Association (ISA) (sigh), Iowa Pork Producers Association (IPPA), Iowa Cattlemen Association (ICA), Iowa Nutrient Research & Education Council (INREC).”
I might remind these other organizations of one of Einstein’s famous quotes: “Unthinking respect for authority is the greatest enemy of truth.”
I’ll finish here by saying we’re decades past the time when somebody needs to stand up to Iowa Farm Bureau. In far too many circumstances, they are a malevolent force here in our state with both their words and actions. We cannot get clean water and a better environment until they have been marginalized and our institutions can operate without fear of reprisal from them. There, I said it.
A couple of notes on Josef Goebbels, the Reich Minister of Propaganda from 1933-1945. A more interesting read about World War II you will not find than his own diary of the period (The Goebbels Diaries, Louis P. Lochner editor and translator). Say what you want about Goebbels, he was good at his job. There can be no doubt whatsoever that somebody in the Trump administration has read this book. Some nuggets:
“Again I learned…the rank and file are usually much more primitive than we imagine. Propaganda must therefore always be essentially simple and repetitious. In the long run only he will achieve basic results influencing public opinion who is able to reduce problems to the simplest terms and who has the courage to keep forever repeating them in this simplified form despite the objections of intellectuals.”
“Justice must not become the mistress of the state, but must be the servant of state policy.”
“News policy is a weapon of war. Its purpose is to wage war and not to give out information.”
“There is nothing worse in politics than weakness.”